Cross Finder
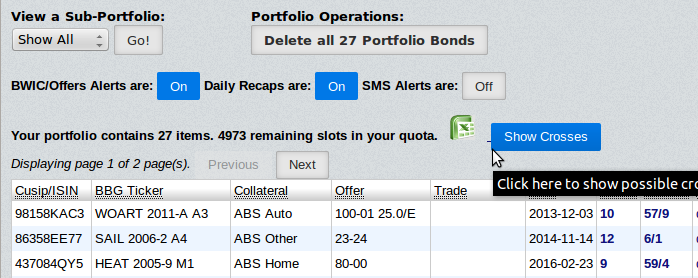
Feb. 29, 2016Our customers often load up client portfolios to their watch lists to find some easy trades off of BWIC matchers or offer sheet matchers. Now you can cross-link sub-portfolios to one another to find trade opportunities among your client base with the Cross Finder feature. Many institutions have such matching tools at the group level, and some enterprise vendors charge large fees to install such products, but Empirasign now puts this power in your hands at the click of a mouse. Hat tip to Alex K for suggesting this product enhancement to us. See below for an example demonstration of the Cross Finder feature, which can be found on your portfolio page.
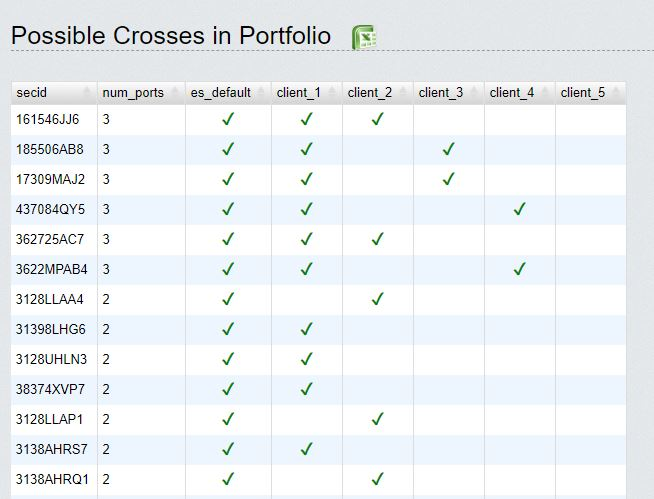
Results of Cross Finder
Probable Sellers
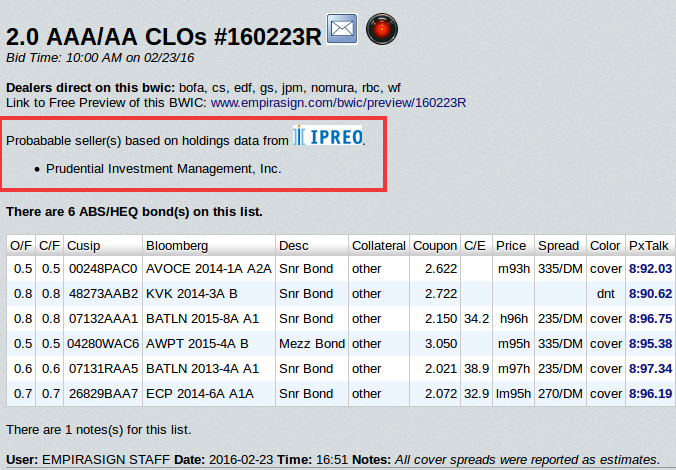
Feb. 22, 2016Using publicly available holdings data filed by mutual funds and insurance companies, we are often able to probabilistically deduce the seller of a BWIC. Our new Probable Sellers feature is the result of this analysis. We compute these probabilities using the Ipreo Holdings Database, which is enhanced with monthly updates provided to Morningstar from mutual funds. An example screenshot is found below. For more on the holdings database we use from Ipreo, please consult this link.
Empirasign London Now Open
Dec. 3, 2015To better serve our overseas clients, we have opened our first office in London. All London market runs and BWIC related data will now be processed in real time. You may have noticed this already by receiving your alerts earlier in the day. The London office will also give us a jump on any NY based data that is either distributed very early in the day or very late the previous day.
Commensurate with serving the London market better, our offer alerts have been extended to cover bid runs and two-way market runs. No changes need to made on your end other than making sure your portfolio page reflects the bonds you want to track. You can navigate to your portfolio page here: www.empirasign.com/portfolio/

Physical Address
Empirasign Ltd
CityPoint Building-12th Floor
1 Ropemaker Street
London, England, UK
EC2Y 9HT
Phone numbers
+44 207 153 1079 (direct)
+44 208 875 4003 (voicemail)
If you require customer support during London mornings, please contact the numbers above. During New York business hours, it is best to reach us at the main office: +1 646-837-8848.
Empirasign Is Hiring
In addition to market data and client support staff in London, we are also looking to add a London-based salesperson. The job description can be found at the following link: www.empirasign.com/jobs/
Trending Bonds
Dec. 2, 2015One of Empirasign's most used features is our Popular BWICs page where you can easily see which BWICs are being viewed by the market most often. We have extended this functionality from the BWIC level down to the bond level with our new Trending Bonds page. Trending bonds, as we have defined, are bonds that are being searched for most often over the last few business days. As with popular BWICs, we have taken measures to ensure no one user can juke the stats. A recent screenshot of this page can be found below, or to see the latest version simply direct your browser to www.empirasign.com/trending_bonds/. This page can also be found under the ListMetrics tab on the top navigation bar.

Trending Bonds Applications
As you can see from the screenshot above, MSBAM 2013-C7 D, is a trending bond. As to be expected, this bond was on a BWIC that day. A screenshot of this BWIC is shown below. What is interesting to note, is that MSBAM was the only bond on this particular BWIC that traded better than its price talk. The upshot is that if you're interested in a BWIC bond and many people are searching for the same bond, you may need to increase your bid to win it. Conversely, if you're interested in a bond that doesn't show up on the trending bonds report, you may be able to buy this bond at cheaper than forecasted levels.

Trending Bonds and Popular Bonds take Empirasign well beyond just a market data product. We are now delivering you information about how the market is reacting to itself. Next stop for Empirasign, sentience.
I Am Direct Button
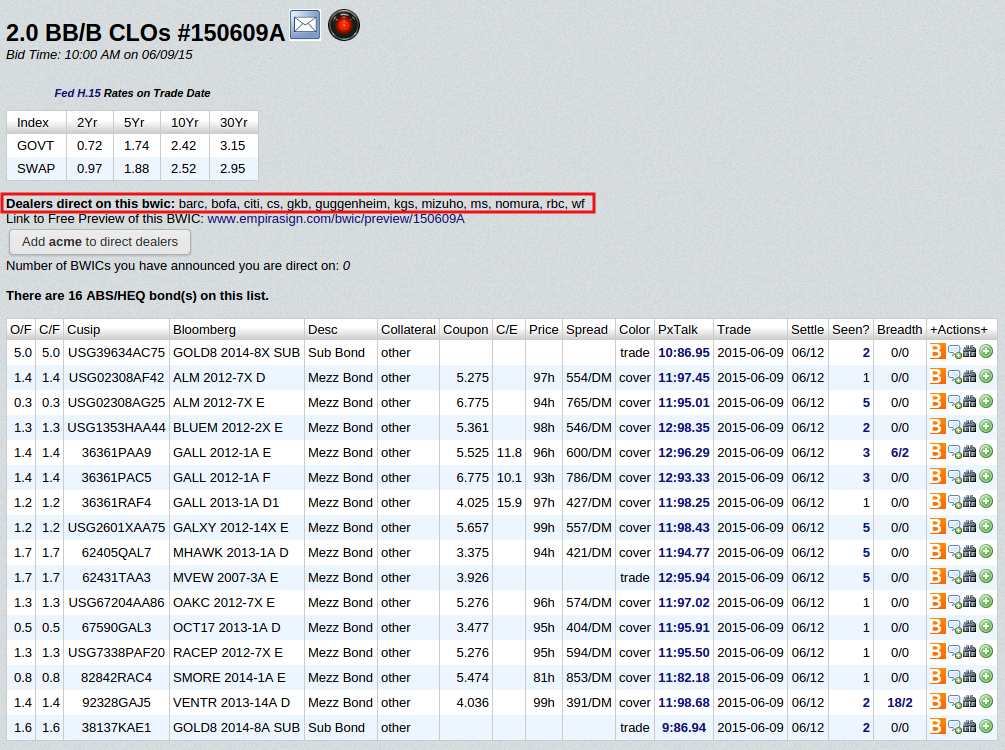
Aug. 5, 2015A list of dealers who have announced they are direct on a BWIC is now displayed on every BWIC page (near the top of the page, just below the BWIC description). With a simple click of the mouse, you can alert your clients or prospective clients that you are directly participating on any BWIC.
Below, you can see an example for a CLO BWIC from June 9th (click image to zoom). Or you can view a live version at this URL (password required): www.empirasign.com/bwic/150609A
How to Use the I Am Direct Button
As usual, Empirasign does a good portion of the heavy lifting for you. If your shop distributes price talk on a BWIC, our data wranglers will assume you are direct on that BWIC. In such instances, you won't have to do any clicking to add your shop's name to the list. If however, you are direct on a BWIC, and we have not captured this info, you can add your shop's name to the list by simplying clicking on the button (as shown below).
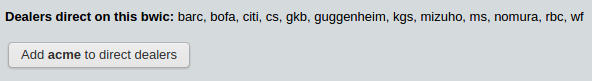
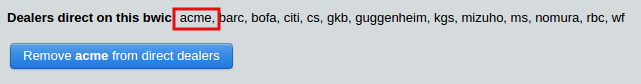
In our example, after clicking the button, Acme Securities has been added to the list of direct dealers (see screenshot below). You can click the button again to remove your firm from the list. Also, if you find your shop on the list of direct dealers and this information is incorrect, you can remove it by clicking the button again.
If you are a salesperson or trader, every BWIC page should display the I Am Direct button below the list of direct dealers.
Help, I Don't Have a Button!
If you do not see the I Am Direct button on your webpage, and you sit in a client facing seat at a bank or broker, please contact us at +1 646-837-8848 and we will grant you button permission ASAP.
How do Empirasign Sell-Side Clients Benefit?
Sell-side clients benefit from smoother and more seamless communication with their customers. You can let your clients know you are direct on a list with a simple click of the mouse, and save your phone calls and Bloomberg messages for more substantive communications. The I Am Direct button can also be used as a credit mechanism. If you are a trader spending a large portion of your day bidding every BWIC and providing liquidity to the marketplace, the I Am Direct button is an efficient way to let the market know this.
You can even share which BWICs you are direct on with those who don't subscribe to Empirasign via our Free BWIC Calendar page which can be reach here: www.empirasign.com/bwic/. The Free Preview link can be found on any BWIC page right below the list of Direct Dealers. The Free Preview link for the above example is: www.empirasign.com/bwic/preview/150609A. This page only shows BWIC contents (no price talk or trade color is displayed there).
How do Empirasign Buy-Side Clients Benefit?
If you want to participate on a BWIC and your go-to set of dealers are not direct on a BWIC, you can easily locate an alternative avenue to participate simply by viewing the BWIC page. As viewing this page is part of your normal work-flow, acquiring this additional actionable information comes at no extra cost.