Surfacing Outliers
Nov. 29, 2022
Introduction
Every month, US mutual funds and ETFs must declare all their positions and valuations (along with a host of other data) via the N-PORT filing. The quarterly versions of this filing are publicly available. Since this report was mandated in 2020, Empirasign has indexed and made available to our subscribers and free findabond page users almost 20 million bond valuations.
Valuation Outliers Report Construction
- Gather all the valuations for all the bonds at each reporting Value Date.
- Roll up these valuations to the registrant level. If an asset manager has the same bond in four different funds, each position in the underlying funds will be marked at the same price. If we don't roll up to registrant level, valuation variance will be greatly and artificially understated.
- For every bond / Value Date combination with ten or more data points, compute IQR and Z-Scores (see below).
- For any mark whose IQR Score is above 1.5 or Z-Score is above 3.5, add to the Outliers Report.
Z-Score
A Z-Score is a standardized measure of how far away an observation is from its reference population's mean. Mathematically, it's computed by taking the difference between the observation and the mean and dividing by the standard deviation. Given our underlying populations often differ from the normal distribution (discussed below), we set the cutoff for our report at 3.5. Usually this level is set at 2.5.
IQR
Inter-Quartile Range (IQR) is the difference between 75th percentile observation and the 25th percentile observation. For each data point above or below the 25/75 percentile, compute its distance as a multiple of the IQR. On a box plot, these so-called Tukey Fences are set at +/- 1.5 IQR. Any points above or below these fences are deemed to be outliers. Under a normal distribution, this rule will flag about 1% of all observations.
A screenshot showing the Valuation Outliers Report as of 11/21/22
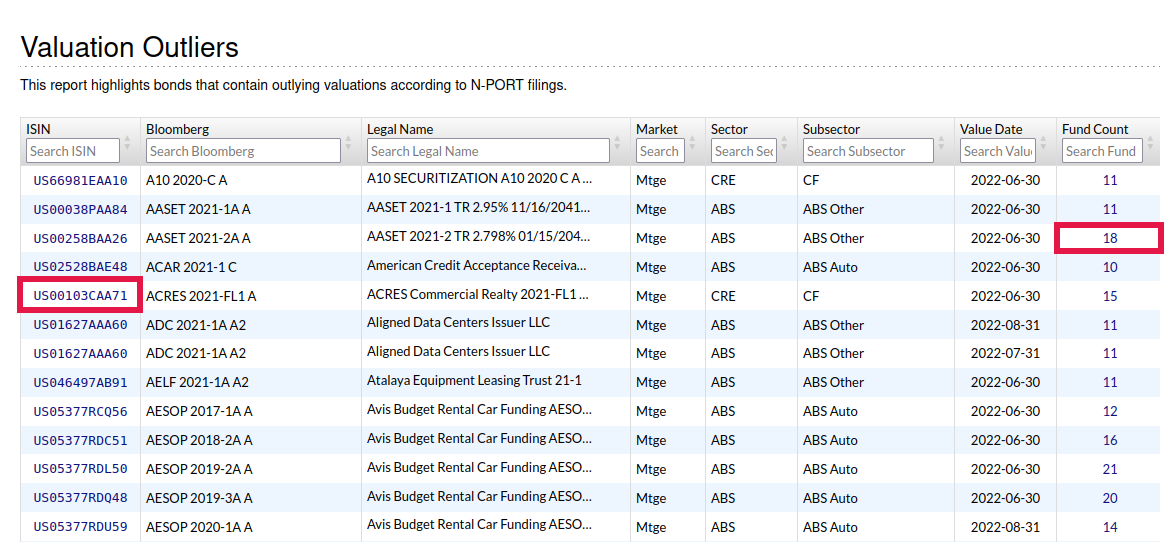
This report is located at the following URL: www.empirasign.com/nport-outliers/. It can also be found under the Market Intel section of the navigation bar.
No login is required to view this page. All Fixed Income sectors are covered, but given our historical focus on Structured Products, this sector appears at the top. Nonetheless, the table is sortable by all header fields--including Market Sector and Value Date. If you click on the ISIN field (item circled in red on the left), you will be directed to the bond's full history page. If you click on the Fund Count field (item circled in red on the right), you will be directed to a box plot of all the valuations for this bond on the given Value Date. Such a plot is an effective way to quickly determine a data set's distribution and any outliers. If you are not logged-in, all clicks will redirect to the relevant findabond page.
Screenshot of the Box Plot for AASET 2021-2A A
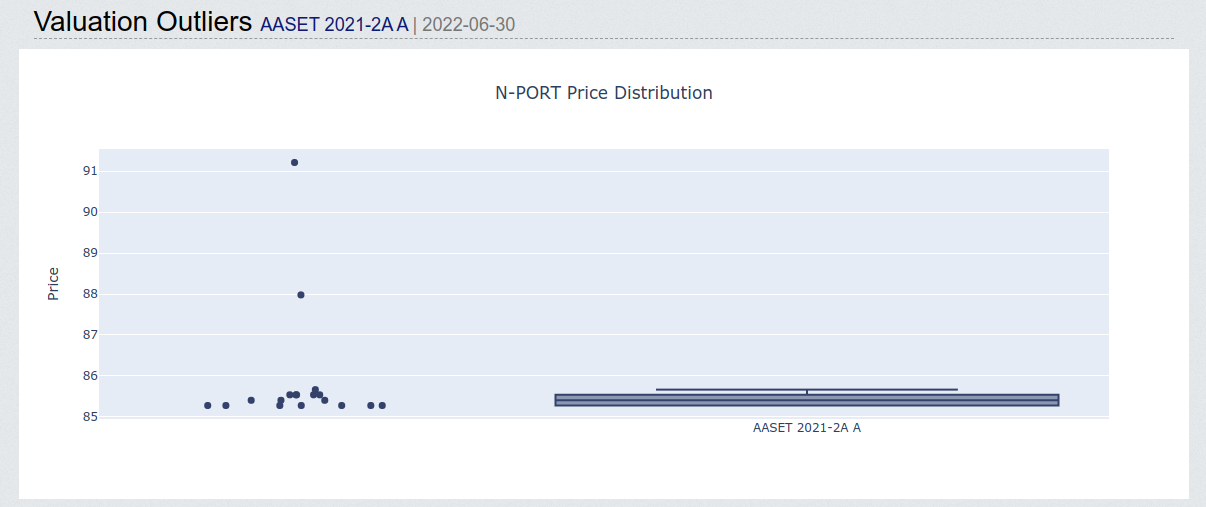
As you can see in the box plot, most valuations are clustered around $85.50, with one outlier at $88 and another way up at $91. Mousing over any of the data points will display a tooltip showing which fund has this bond marked at the targeted price.
URL for the chart being discussed: www.empirasign.com/nport-outliers/US00258BAA26/2022-06-30/
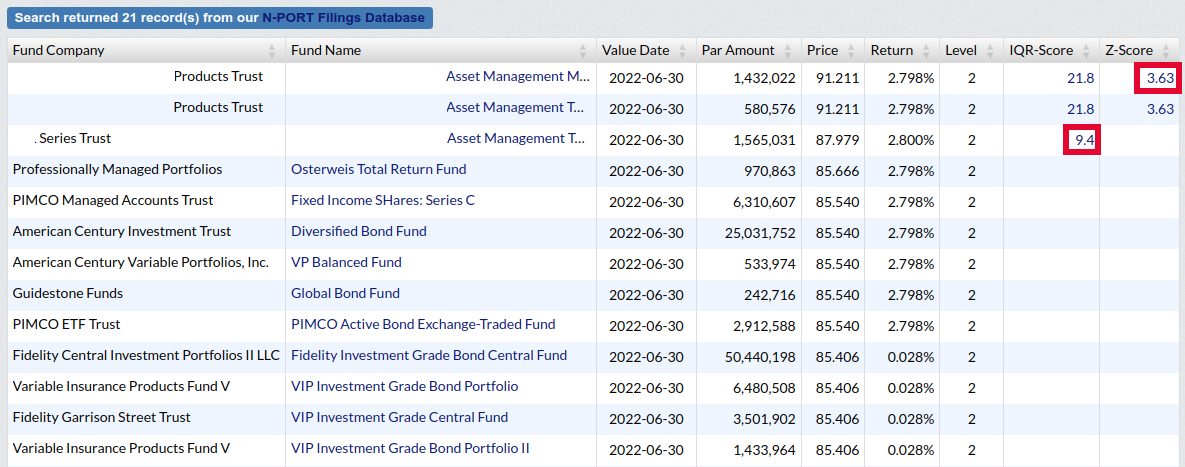
On the same page, below the box plot, is a table of all the funds who have a position in this bond on Value Date, and the price that each fund marked the bond. All outlier marks will have Z-Score and IQR Score metrics displayed. If such metrics are below 3.5 and 1.5 (Z-Score and IQR respectively), no metrics are shown. By clicking on any of these displayed metrics, you'll be directed to a page showing all outlier marks for the fund and Value Date in question. In the example screenshot below, an IQR Score of 9.4 is clickable for one fund, and a Z-Score of 3.63 is clickable for another. Both are circled in red.
Finding Outliers without Even Trying
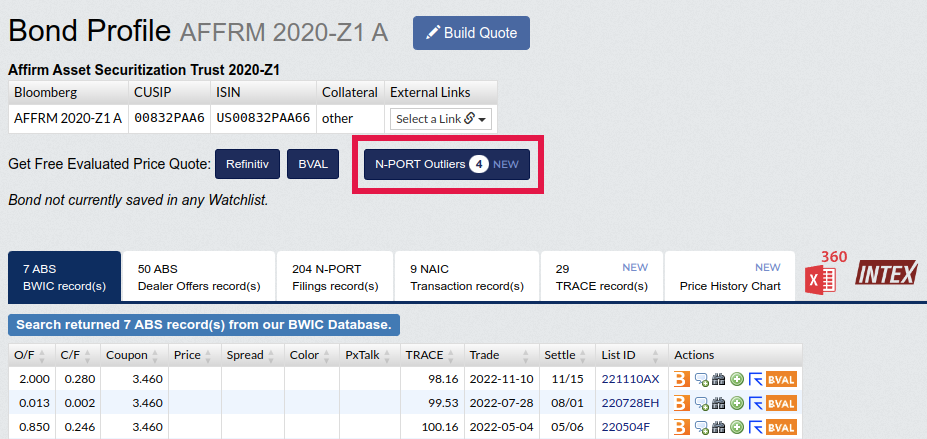
Wherever possible, we'll draw your attention to valuation outliers. On the bond history page you'll see a badge that says N-PORT Outliers. Clicking on this badge will take you to the box plot and table report page as discussed above. Similar N-PORT Outlier badges are displayed on Fund Holdings pages (as applicable). Fund Holdings can be searched at the following the link: www.empirasign.com/fund-holdings/. This page can also be found on the navigation bar under Query Tools.
Screenshot of bond history page with N-PORT Outliers badge:
Why Is This interesting?
As with the High Variance Marks Report, where there's uncertainty there's opportunity. Instead of highlighting uncertainty, this report is highlighting possible anomalous valuations. You can use knowledge of outliers to drive trades:
- Purchase bonds from funds who have a position marked low.
- Sell bonds to a fund who has a position marked high.
Another Disclaimer
Just because a bond's valuation is well beyond the Inter-Quartile Range does not necessarily mean the position is mis-marked. It could very well be the high or low mark is a better estimate of the true market value, and the crowd around the mean is just plain wrong. Furthermore, IQR and Z-Score based flagging methods are very susceptible to varying or unknown variance. It's easy to imagine a scenario where funds with December 31 year-ends use more pricing vendors and methods than funds having November 30 year ends. In such a scenario, the December 31 crowd would have a higher underlying variance. As such a bond 2 points from the mean may not be flagged on the December 31 Value Date, but such a price difference would be flagged for the November 30 Value Date. As above, we try to be pretty careful about how we pick and assemble these data sets to minimize the number of tricky or error-prone scenarios. Regardless, the underlying distribution of marks for many bonds may not be normal due to any one of a number of factors and divergences from the normal can also cause flagging of false outliers. Easy to observe bonds with easy to model collateral should have wide agreement as to valuation. In this scenario any very slight difference from the mean would be flagged as an outlier. The opposite side of this coin are bonds with lots of marking variance. Large discrepancies from the mean may be safely, or unsafely, ignored due to large amounts of noise. To keep abreast of such noisy scenarios, please direct your attention to our High Variance Marks Report. In summation, and as indicated previously, caveat emptor.
More Resources
- Our blog post on High Variance Marks: www.empirasign.com/blog/High-Variance-Marks/
- You can read about additional ways we utilize N-PORT filings data in this blog post: www.empirasign.com/blog/NPORT-Filings/.
You can read about how to extract N-PORT filings data via API call on our Market Data Docs page and newly updated Developer Resources page. Links below: